
How can you tell if your webinar funnel is working at peak performance? What funnel analytics should you be tracking to ensure that your efforts are yielding the results you are aiming for?
We’re covering all of this and more below. You can go to a specific section or just jump right in.
Table of Contents
StealthSeminar Built-In Funnel Tracking
Three of our Most Powerful Funnel Tracking Features
Using Funnel Analytics to Increase Webinar Conversion Rate
Learn More About Increasing Your Webinar Conversion Rate
Funnel Analytics Explained
According to BusinessDictionary, analytics is defined as “The field of data analysis. Analytics often involves studying past historical data to research potential trends, to analyze the effects of certain decisions or events, or to evaluate the performance of a given tool or scenario. The goal of analytics is to improve the business by gaining knowledge that can be used to make improvements or changes.”
Funnel analytics then, or webinar analytics, involves studying a sales funnel’s effectiveness based on actions taken as someone moves through it. In this case, our focus is on an automated webinar funnel and what happens at each step within it. The goal of examining your webinar analytics is to learn important information about the people who are going through your funnel so you can optimize it to yield the best results possible.
For example, at which step in the funnel did visitors drop out of your sales process? By determining that, you might be able to make simple changes to your funnel that results in more people successfully moving from the beginning to the end of the funnel, yielding more sales.
StealthSeminar Built-In Funnel Tracking

Did you know that StealthSeminar automated webinar software includes built-in funnel tracking? Using Event Tracking Pixels, you can view the number of impressions and clicks each step of your funnel gets.
So, let’s say your funnel looks like this:
Step 1 — Webinar Registration Page
Step 2 — Webinar Thank You Page
Step 3 — Webinar Viewing Page
Step 4 — Product/Service Sales Page
Step 5 — Thank You for Your Purchase Page
By using our Built-In Tracking, you will be able to analyze each step of your webinar funnel and determine where your potential clients dropped off.
Pro tip: Make sure you use the Sales Tracking Pixel to know exactly how much your webinars are earning.
When using our Sales Pixels, you get a deep understanding of the profits earned from individuals who successfully make it to the end of your funnel. To get this data, all you need to do is add our sales pixel to your “thank you for purchasing” page.
Three of our Most Powerful Funnel Tracking Features
Split Testing

Suppose you have a registration page that is doing well, but you feel it could be doing better. Using our split testing feature, you can duplicate a registration page, make the changes you think will improve the page, and compare how well each one performs. Whichever one is doing better in terms of conversions is the one you’ll keep.

Pro tip: Change your new page so it is significantly different from your original page. Don’t simply change the color of a headline or add an extra bullet. Doing so is unlikely to give you a significant difference in conversion rates.

We recommend split testing several adjustments at the same time to see notable shifts in your conversion rates, change templates, colors, photographs, headlines, buttons, and more. Then, pick out the best option based on performance. Once you have a high converting registration page, you can focus on split testing more details to optimize it further.
Attendee Tracking
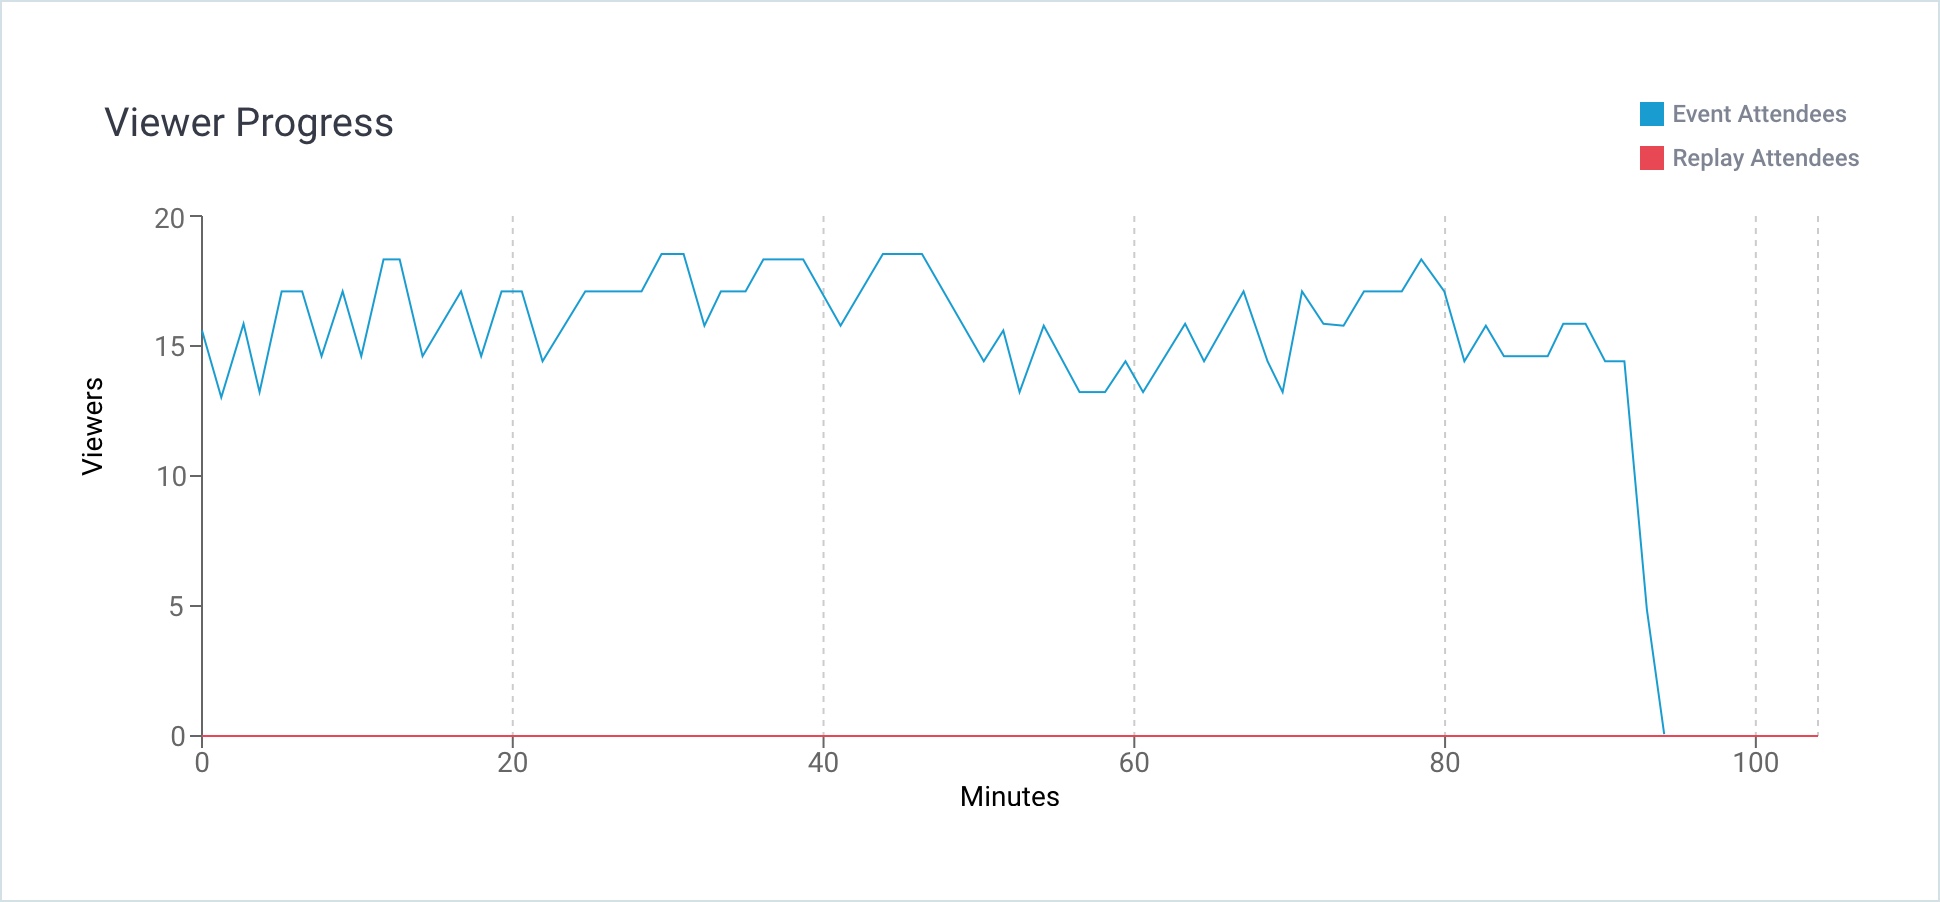
Many webinar software platforms give you stats on the number of attendees. We take it a step further. With our internal Viewer Progress graph, you can see what percentage of viewers were watching at multiple progress markers. For example, we can show you the viewership numbers in the first 10 minutes, the 20-minute mark, the 30-minute mark, and so on through the ending of your presentation.

This data can be extremely helpful in telling you whether or not your presentation keeps viewers engaged. For example, if you see an extreme dropoff at the 30-minute mark, perhaps your audience prefers presentations that are shorter. It could also mean that viewers lose focus at this point, and you need to implement something engaging to hold their attention longer. Either way, the more you learn, the more you can tweak and improve.

StealthSeminar Statistics Domination Dashboard

Our dashboard features the data from Split Testing and Attendee Tracking, but it goes much further than that. You can view an estimate of dollars generated by date range, get the specific data for impressions and clicks from each step of your webinar funnel, and even see individual stats for individual attendees.
For example, suppose Tom signed up to watch your webinar. You can view Tom’s stats and learn that he signed up on the registration page, watched the whole webinar presentation, and saw the call to action (CTA) but didn’t click it. Using this information, you can send a more targeted follow up like:
“Hey, Tom!
I saw you attended the webinar but didn’t check out our sales offer. I’d love some feedback as to why? Was the price point too high? Perhaps now isn’t the right time. Are there any questions you’d like to have answered? Hit me back with a reply, and I’ll help you in any way I can.
Thanks,
Jerry”
Using Funnel Analytics to Increase Webinar Conversion Rate

Suppose you find in your funnel analytics report that 65% of your viewers drop off your automated webinar funnel at the very first step, registering for the webinar. This could be a sign that the written copy of your registration page is not resonating with your visitors.
Perhaps, your registration page is too long. Maybe it’s too short. There could be a need for more pictures or fewer pictures. The point is that you need to test what works and what doesn’t by using webinar analytics so you can optimize your webinar funnel.
Instead, let’s say that 50% or more of your prospects are dropping off at the sales page. This could indicate they are not ready to buy. Or it could mean they think the price point is too high. At this point, something you can do is send an email to those that signed up, asking them what made them leave the page. From there, any responses you receive could help you better understand what your prospects are looking for. Maybe they need a payment plan to seal the deal, or perhaps they felt the offer didn’t give them enough for their money so you throw in a few bonuses.
Once you start analyzing your data, you can get crystal clear on things like:
— Who is visiting your landing pages
— How many people are visiting and where they are coming from
— When people are leaving your pages
— What percentage leaves without taking the action you want them to take
— What your audience wants
— The things that make them object to making a purchase
The more information you can gather at each step, the better.

Pro tip: Analyzing your data is especially important when you are trying to scale your efforts using pay per click (PPC) ad campaigns.
Learn More About Increasing Your Webinar Conversion Rate
In our Automated Webinar School, we teach you everything you need to know about creating, recording, and filling a high converting automated webinar. We give you outlines for developing your presentation, as well as our proven templates for creating your webinar slides. Click here to sign up for our free training today
And, when you’re ready to put your lessons into practice, we have a free 30-day trial to try our automated webinar software with no credit card required. Try us out and start making money before you even buy it! Sign up for free here.


